May Zoopla Market Report
House price growth at +4% again!
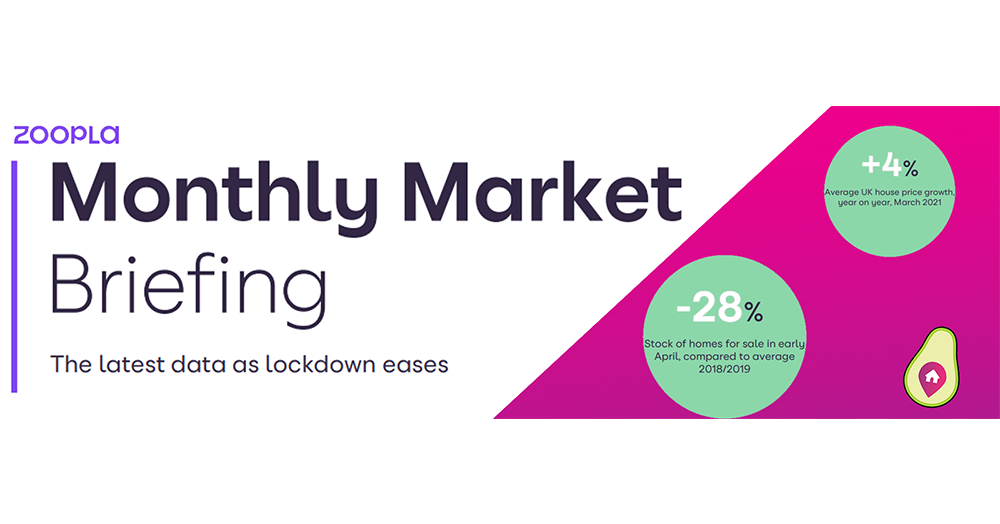
Average annual house price growth has been at +4% or above since last November, the highest levels of growth seen since 2017. Price growth is being underpinned by the ongoing mismatch between soaring demand and the limited supply of homes available for sale.
House prices are growing fastest in the Midlands, the North of England, Scotland and Wales, where affordability levels mean there is more headroom for home values to rise.
Average house price growth in the year to March ranges from 6.5% in Manchester, and 6.3% in Liverpool, to 1.6% in Oxford and 2% in Cambridge.
Strong buyer demand
The demand from home movers and first-time buyers hit a new peak in early April, as the combination of the stamp duty extension and schools reopening in March resulted in another surge of buyer interest.
This took buyer demand levels to more than double than those seem during the same period in 2017-2019.
As the country has started to emerge from lockdown, and more amenities are opening, demand levels have fallen back slightly. However, demand levels are unlikely to drop in line with historical norms in 2018 and 2019.
Supply starts to climb from low levels
There are few signs that the gap between buyer demand and the supply of homes for sale is starting to close in any meaningful way.
In early April, the total supply of homes for sale was down some 28% compared to the same period in 2018/19. The ‘search for space’ means there has been a particular demand for three and four-bed houses, meaning the supply of this type of home has been constrained. Back in 2017, more than three-quarters of listings of homes for sale were houses. This has now fallen to less than two- thirds.
In recent weeks there are signs that supply levels have begun to rise, up 29% from low levels. This is not enough to replenish the stock of houses that are being sold.
However, the largest rise in supply has been for larger family houses, meaning that the severe constraints in supply in some areas may start to ease, allowing more activity to take place throughout Q2 and Q3.
Lots of changes week by week.
Make sure you are following us on Facebook or Instagram for live and up to date information (and a little bit of entertainment too!)